

- Bitcoin price continues to gather bullish momentum as its recovery eyes a retest of $23,500.
- Ethereum price grapples with the 200-week SMA as bulls look to revisit $1,730.
- Ripple price faces massive hurdles, other altcoins that have experienced highly volatile unlike recoveries.
Bitcoin price has shown incredible resilience after its massive crash in the second week of June. Since then BTC has produced considerable gains over the past week and the start of a new week brings the promise of even higher returns.
Bitcoin price bounces back
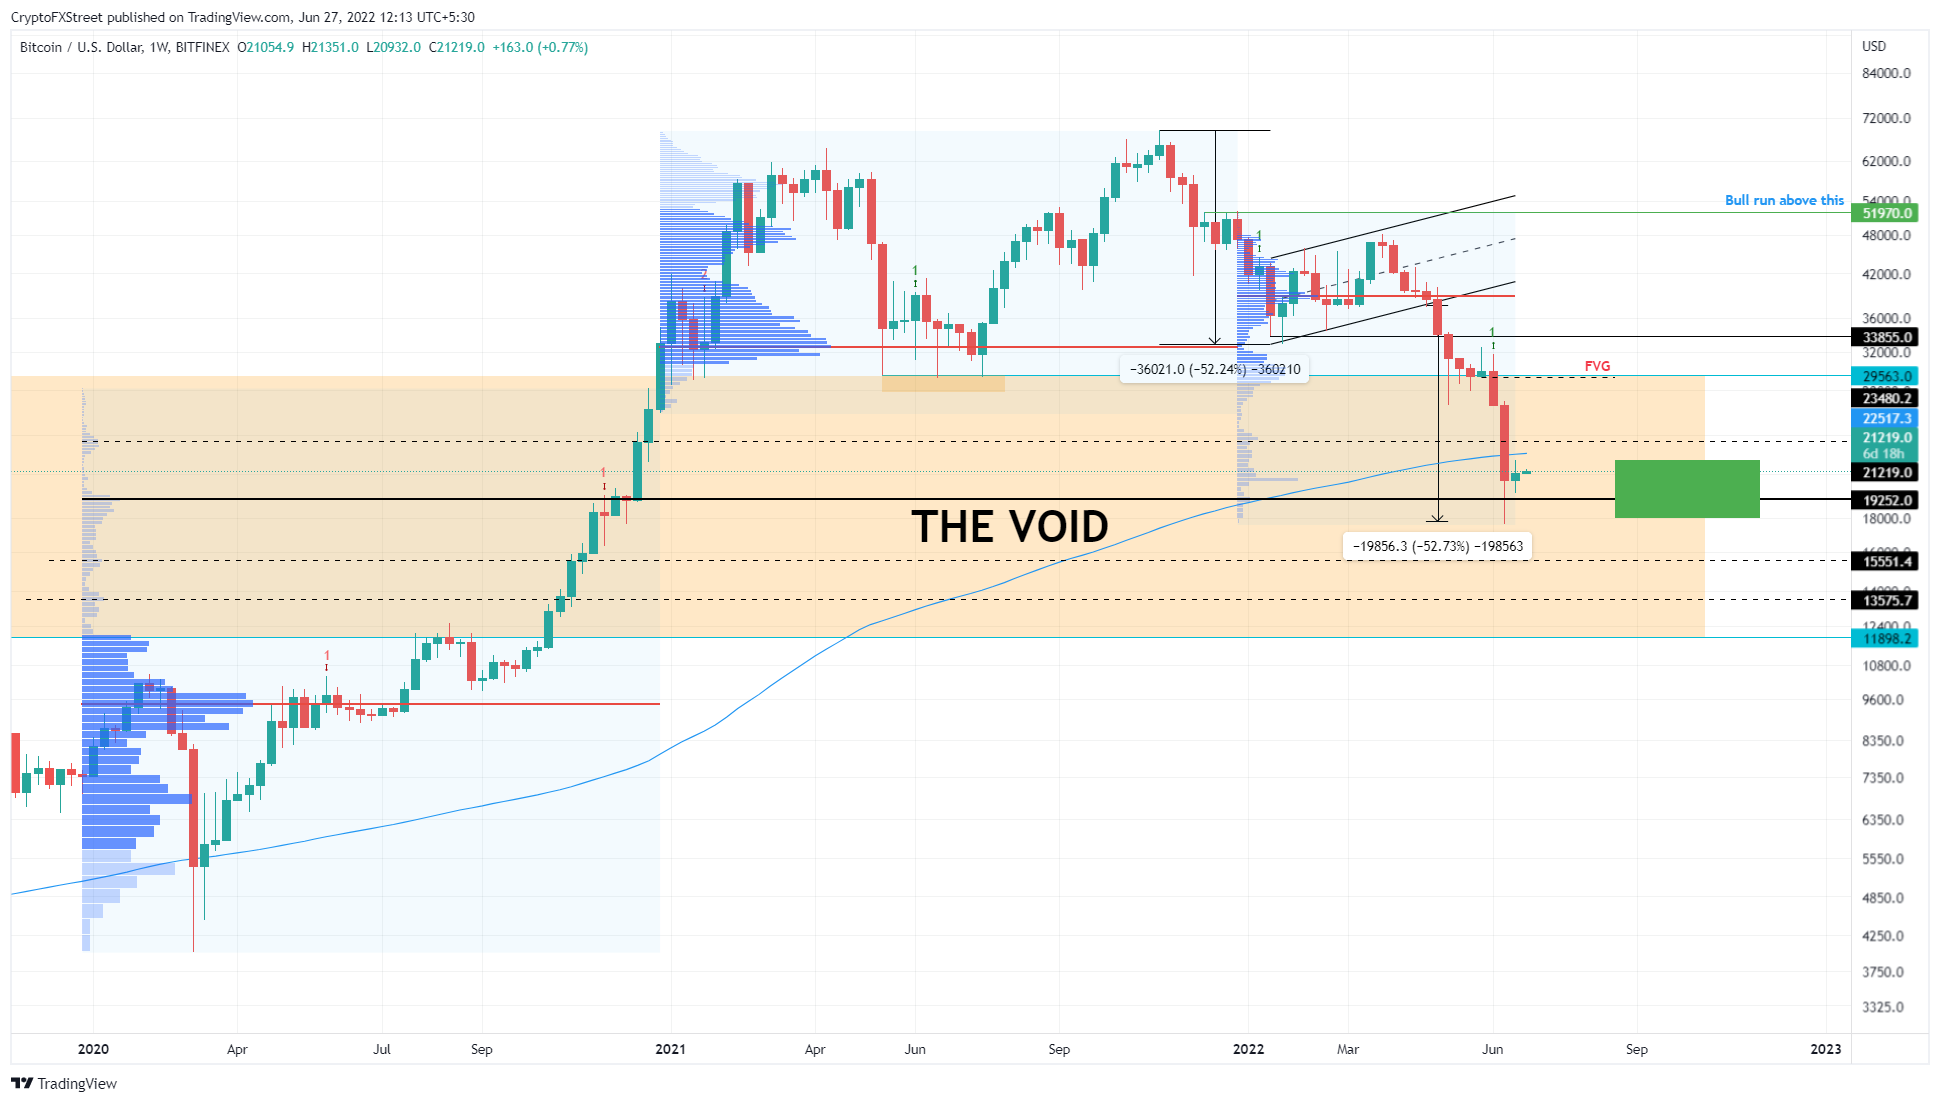
Bitcoin price bounced off the $19,252 support level and has recovered 21% from its recently formed swing low at $17,605. If this impressive bounce continues, BTC will face the 200-week Simple Moving Average (SMA) at $22,517.
This hurdle is crucial and will determine the directional bias for the upcoming weeks or months. A successful flip of this hurdle into a support floor will allow Bitcoin price to rally and retest the $23,480 barrier.
The upside for the big crypto is likely to be capped around this level, at least until it is overcome. In a highly bullish case, however, BTC could extend higher and tag the inefficiency formed on the weekly chart at $29,300.
BTC/USD 1-week chart
While things are looking up for Bitcoin price, rejection at the 200-week SMA will indicate buying weakness. In such a case, if BTC produces a weekly candlestick close below $19,252, it will invalidate the bullish thesis and trigger a 19% crash to 15,551.
Ethereum price takes control
Ethereum price seems to be much more handsy with the 200-week SMA than Bitcoin. ETH is already grappling with this significant resistance barrier. Interestingly, this level also coincides with the $1,224 resistance barrier.
Hence, a swift move beyond this confluence will indicate that buyers are back in control. In such a case, Ethereum price could trigger a 35% run-up to the $1,730 hurdle.
ETH/USD 1-week chart
However, if Ethereum price fails to conquer the $1,224 barrier, it will indicate that the sellers are still in control. In this situation, ETH could crash 40% to the immediate support floor at $745.
Ripple price has a long way to go
Ripple price has recovered well before tagging the inclined support trend line, extending from April 2017. This premature bounce suggests that sellers are facing exhaustion and buyers are taking over.
Unlike other cryptocurrencies, Ripple price needs to overcome the $0.418 weekly resistance barrier before encountering the 200-week SMA at $0.491. Assuming the buyers step in and flip the said barrier into a support floor, this rally would constitute a 37% gain from the current position.
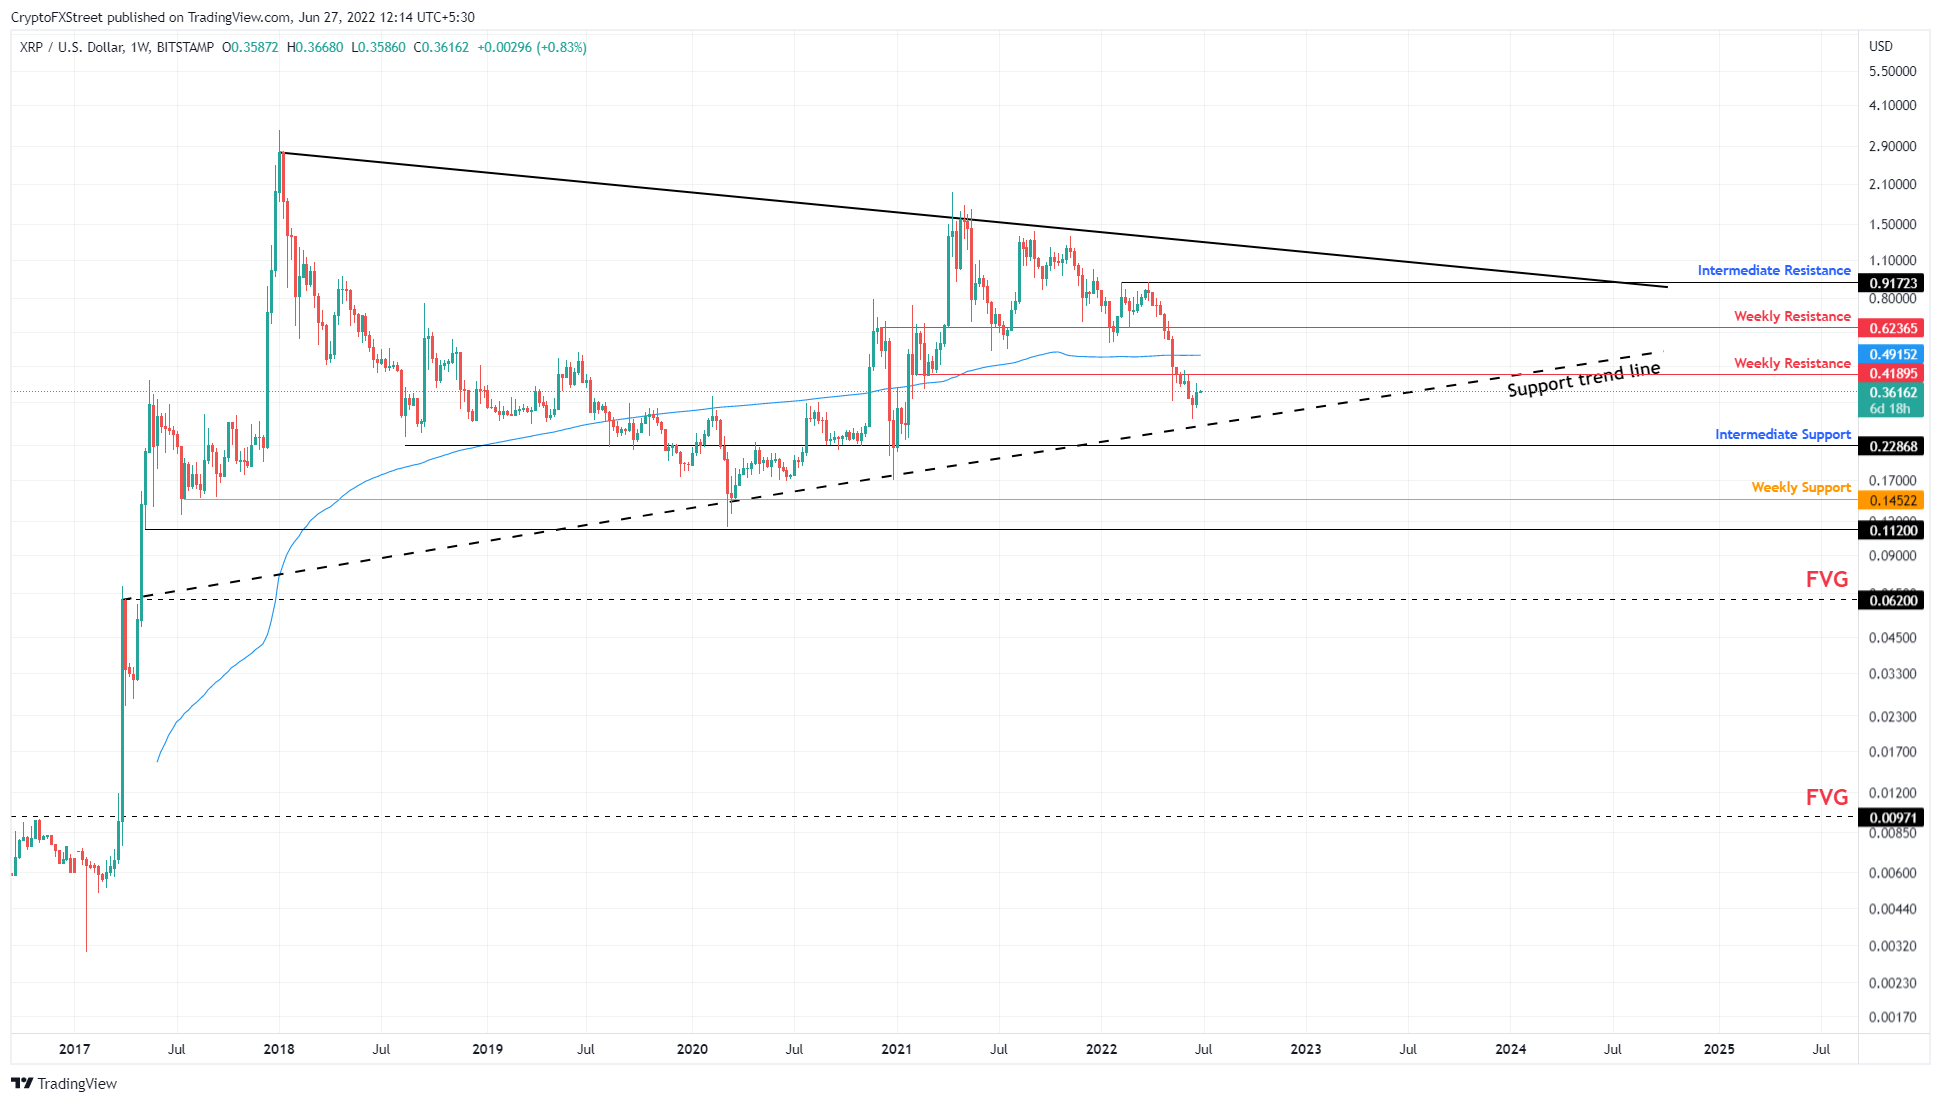
XRP/USD 1-week chart
On the other hand, if Ripple price faces a massive uptick in selling pressure around the immediate resistance barrier at $0.418, it will suggest that sellers are done recuperating. In such a case, XRP price could crash lower and retest the inclined trend line or the immediate support level at $0.228.
.